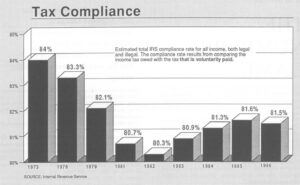
Production statistics collected by the Internal Revenue Service suggest that taxpayers in different parts of the United States do not receive equal treatment from the giant agency. Some of the apparent disparities are astonishing. While 21 out of every 1,000 taxpayers were audited last year in the IRS’s San Francisco district, only 6 out of 1,000 taxpayers faced the same process in Massachusetts.

Data published in the IRS’s most recent annual report and information provided by the agency appears to indicate many other similar aberrations.
Why did the IRS audit only 9 out of 1,000 taxpayers in Chicago, when 15 out of 1,000 were audited in Manhattan? Why were the returns of 7 out of every 1,000 Iowans examined, when 15 out of every 1,000 North Dakota taxpayers were asked to defend their financial claims to the government? Does it make sense that Utah taxpayers are almost twice as likely to face audits as those living in Colorado?
The district to district auditing variations appear even more astonishing when economic factors such as the average income and the percentage of taxpayers earning $50,000 or more are considered. Last year, for example, the average income of Massachusetts taxpayers was $24,277 and 9 percent of them earned at least $50,000. In San Francisco, the average income was $25,763 and 10.8 percent were in the agency’s top class of taxpayers. But does San Francisco’s slightly richer economic mix explain why its overall examination rate was three times that of Boston?
Finally, there is this data point: the average additional tax and penalty recommended by the IRS for each individual whom it found wanting. Augusta, covering the state of Maine, is at the top of the hit parade with $19,425. The taxpayers in Jackson, Mississippi, appear to be just a little poorer than those in Maine, but the average additional tax and penalty there is only $3,222. (Because of the ambiguities of the tax law and the reluctance of taxpayers to part with their money, it may be comforting to know that the IRS usually collects a lot less than it initially claims the taxpayer owes.)
The IRS contends that the anomalies are extremely misleading and largely disappear when the different mix of taxpayers living in each of the agency’s 63 districts are taken into account. But the questions remain. Are the disparities as dramatic as they appear? Or are IRS officials correct when they argue that similarly situated taxpayers living in different parts of the country receive essentially equal treatment? How, in fact, does the IRS select the tiny fraction of taxpayers that is audited each year? Finally, are the district to district variations which IRS does acknowledge evidence of poor administrative practice or a sensible flexibility?
To answer these questions, it is necessary to have a rough understanding of the IRS and the way it goes about the complex job of deciding which taxpayers are going to be examined. Last year, the IRS examined only 1.09 percent of the 102 million returns filed by individual taxpayers. This is down from about 5 percent in the 1960s, in part because the growing complexity of the tax law means that each audit takes more time.
The job of looking over the returns and deciding who was naughty and nice is performed each year by the IRS’s Examination Division, one of the largest specialized units within the agency. (There are many subdivisions in the IRS. Along with the Examination Division, the Collection Division and the Criminal Division are the best known to the public. As their names imply, the Collection Division specializes in the unpleasant business of dunning delinquent taxpayers. The much smaller Criminal Division conducts investigations when a criminal, rather than civil, violation is suspected.)
The planning and research office of the Examination Division is headed by Thomas Andretta, who operates out of a small, sunny office on the second floor of the IRS’s national headquarters on Constitution Avenue in Washington.
“What we try to do is audit the most non-compliant returns,” Andretta explained during a recent interview. To accomplish this difficult goal, the IRS has established an enormously complex system of research and classification.
The first step in this gigantic sorting process is the Taxpayers Compliance Measurement Program or TCMP. The heart of the program is a large national survey of 50,000 randomly selected taxpayers. These lucky ones have been scientifically chosen to represent all of the 102 million other Americans who filed an individual return. The IRS puts the TCMP taxpayers through a special audit that requires them to document every single claim made on their income tax return. The detailed results of the TCMP audits, which are conducted every three years, are then fed into the agency’s computers. The primary goal here is not to catch tax cheats but to develop a massive set of statistics on the probable behavior of a national sample of Americans as they fill out every line of their tax returns. Who is doing the chiseling? Where does the chiseling occur? How much is being chiseled?
On the basis of the regular TCMP surveys, which the IRS has been conducting since 1962, the agency has established 12 major classes of taxpayers. The different classes are divided by primary source of income (salary, business or farm) and the amount of income. Classes One and Two earn less than $10,000. Class Six earns $50,000 or more. (The rapid growth of upscale Americans in the last few years recently led the IRS to decide that it will add a separate new income class, those earning $100,000 or more.) The TCMP statistics thus allow the IRS to estimate the proportion of Americans assigned to each class that will try to shortchange the government, how they will go about doing it and how much the government would recover in each class if the full amount were paid.
From this extraordinarily complex set of statistical profiles created by the Taxpayer Compliance Measurement Program emerges the second step in the IRS effort to identify “the most non-compliant” taxpayers. The second step involves what is called the discriminate function–DIF–methodology. DIF is one of many different statistical techniques used for making predictions. With DIF, a set of variables are identified which, at least in theory, best predict the behavior of the group that is being examined. Weights are assigned to each of these variables according to their predictive power. Outside the IRS, the DIF methodology has been used by the credit industry to evaluate potential customers. In the case of the IRS, the methodology gives the agency mathematical procedures to rank every one of the returns in each of the various income classes according to the probability of non-compliance. The ranking is accomplished by computers.

Then the IRS selects different cutoff points for each income class. All those with DIF scores above the magic number are in the “need to examine” groups and those below it are in the “no need to examine” groups. As a matter of policy, however, the IRS sets the DIF cutoff values so that many more returns are placed in the need to examine groups each year than ever will be examined.
A high DIF score, however, is only one of several routes to examination land. This is because the IRS has developed at least ten other methods for identifying questionable returns, some of which also are computerized. One special program, for example, is designed to rank returns that claim tax shelters. Some examinations are initiated on a more subjective basis. Suspicions of an investigator in the Criminal Division, for example, can trigger the initiation of an audit by the Examination Division.
But Andretta’s work in marshalling the TCMP data to establish homogeneous classes of income taxpayers and then select the desired DIF cutoff points for each class is only the starting point. The second major part of the job is to create a national plan that describes the percentage of taxpayers in each income class that the Examination Division should audit. This plan instructs the IRS troops in the field to examine X percent of one class, Y percent of a second class and Z percent of a third. With these marching orders in hand, the troops then go to the DIF ranked returns that have been stacked in each district and go to work.
That, according to Planning Director Andretta, is how the IRS’s national examination plan is developed and published. That is the plan.
But doesn’t finding that San Francisco taxpayers are three times more likely to be audited than those living in Massachusetts prove the troops are not following the plan?
“No,” he replied. “Your table smushes up a lot of numbers that should not be jumbled together. Each district has its own economic complexion, its own distinct mix of taxpayers. Regardless of where they live, we try to treat similar classes of taxpayers the same way.”
“Do you mean that a San Francisco taxpayer with $50,000 income and a little tax shelter will be treated in exactly the same way as a person with the same income and the same tax shelter who is living in Boston?” I asked.
“As close as we can come,” he answered.
Andretta had left himself a little bit of wiggle room. Just how much is uncertain. But as explained by IRS executives and agents in different sections of the country, and as confirmed by Andretta himself, production does not always conform to the plan.
Robert Miller is an experienced agent now assigned to the IRS office in Wheaton, Maryland, a suburban area close to Washington, DC. He has also worked for the agency in Chicago and Long Island. “Districts can have very different characteristics,” he explained. “When I worked in Chicago, the director there was very aggressive and statistics minded. He pushed production very hard. In the Brooklyn district, which takes in Long Island, the whole office worked differently. In my view, it was much more prudent, much more professional and much more willing to look at each situation on a case-by-case basis. Maybe this goes with the live and let live attitude of New York, the original melting pot city.”

Andretta agreed with Roberts that there can be some district-to-district variations, but argued that the overall impact was minimal. Interestingly, he then pointed out that the annual examination guideline developed each year in Washington specifically authorizes district directors to launch their own independent examination projects. In the IRS’s general guidelines for fiscal year 1988, for example, seven priorities are established to guide the managers in deciding where to point their guns. The first item in the national priority list was the returns that had been selected for examination under the Taxpayer Compliance Measurement Program. The second priority was the returns which had been put on the top of the heap by the tax shelter selection process. The sixth priority was “locally initiated work.”
This is the way Andretta described the sixth priority: “Mr. Director, if you find areas of noncompliance that you think are deeper than those indicated by the plan, then by all means deviate from the plan. So, the director in Boston, for example, might decide there is a special problem among the fishermen in his district, identify who they are and undertake a large number of examinations of them.”
Could such locally initiated projects destroy the goal of even-handed enforcement? “That depends on how you define even-handed,” Andretta said. “I define it as auditing the most abusive returns wherever they are filed.”
Another important factor that may get in the way of auditing on an even-handed basis throughout the country involves the problem of having sufficient numbers of trained auditors to undertake the work. One senior IRS official, for example, told me the primary reason why the audit rate was low in Massachusetts was that the Boston District Office was having trouble hiring auditors because of the competitive job market in the booming New England economy.
Andretta confirmed that local economic conditions sometimes created obstacles to hiring the correct number of trained people. “Right now,” he said, “the IRS is very big in Texas, where the economy is having some trouble. We have lots of employees in Texas and lots of returns are being examined. Boston is tough. New York City is tougher. In fact, we’re trying to get salary supplements from the Office of Personnel Management to make us more competitive up there.”
The planning official said he believed such hiring problems caused some minor and generally short-term variations in the examination levels of different districts. “There can be all kinds of reality that intervene. Say one district has a lot of old agents who all retire at about the same time. That means we will have to hire a large group of young and relatively inexperienced people. The result: for the first couple of years in that district we won’t have the folks we need to audit the most complex returns that are filed there. But within a year or two our training programs correct the problem.”
The IRS does not normally publish statistics showing the percentage of income tax returns that are examined in each of the agency’s 12 general classes of income within each of the agency’s 63 districts. It obviously would be a formidable job. But without such numbers it is impossible to independently confirm Andretta’s assurance that the agency’s TCMP survey and DIF formulas have resulted in generally equal treatment for similarly situated taxpayers regardless of where they live.
Evidence exists, however, suggesting that in some other areas of its operation the agency has failed to respond in an entirely rational way to problems that had been identified by the planners.
As mentioned earlier, for example, there has been a steady decline in the percentage of tax returns that the IRS has been able to examine. In 1981, 18 out of every 1,000 returns were audited. In 1987, only 11. During this seven-year period, there thus was a 49 percent decline in the IRS examinations for all taxpayers, rich and poor.
But the benefits of this decline – freedom from examination – have not been equally shared by the American people. In 1981, 78 out of 1,000 taxpayers reporting an income of $50,000 or more were audited. In 1987, only 22. There thus was a 73 percent decline in IRS examinations for upper income taxpayers.
Why? Why did the IRS allow the percentage of upper income tax returns that were being examined to decline at a faster rate than for the population at large? Given the general findings of TCMP surveys over the years that the frequency and amount of tax income under-reporting increase with income, why did the IRS fail to maintain its audit presence with this group?
Was this a reflection of the obvious pro-business bias of the Reagan administration? Or is there another explanation?
A major part of the answer appears to be that the IRS did not keep up with the runaway economic demographics of the period. During most of the 1980’s, while the number of IRS employees remained roughly constant, the absolute number of taxpayers reporting an income of $50,000 or more underwent a four-fold increase. In 1981, there were 2.5 million such taxpayers. In 1987, there were 10 million.
It was this huge increase in upper income taxpayers, and the failure of the IRS to re-train its personnel to handle their more complicated returns, that caused the rapid decline in the proportion of the rich and super rich who the IRS actually audited. This growth was so swift, in fact, that the proportion of class six taxpayers who were audited plummeted, even though the absolute number of audits on the rich folks increased from 176,000 in 1981 to 225,000 in 1987.
Other kinds of conscious policy considerations also may have been involved in the IRS’s decision to ignore the equity implications and allow the percentage of high-income tax audits to decline. Research done by Professor Susan B. Long of Syracuse University’s School of Management shows that, as might be expected, auditing a person who earns $10,000 almost always takes less time than examining the return the taxpayer earning $50,000. If an important goal of the IRS was to continue to audit as many taxpayers as possible, the agency might decide to examine fewer time-consuming rich people so that it would more have more staff time to maintain the overall statistics.
Another complex question for the IRS is the yield the agency can harvest from each tax class in relation to its administrative costs. If the IRS can get more bang for each of its bucks concentrating on middle-income people, it may decide to ignore the rich. Whether such a calculation might have been influenced by the trickle-down economic theories of the current administration is impossible to prove.
Syracuse University’s Professor Long has been studying the IRS for fifteen years. As a result of a successful series of requests to the IRS under the Freedom of Information Act, she now possesses an enormous hoard of research and performance statistics that the agency normally does not publish. Three years ago, Dr. Long studied the regional assignment of IRS officials in the periods both before and after the existence of the TCMP surveys.
Her question: would the production data prove that the IRS responded to the TCMP findings by shifting staffing from the return classes and regional areas with highest compliance rates to those with the lowest?
Her astonishing conclusion: “In general, the introduction of TCMP compliance data did not bring about any dramatic restructuring in audit coverage – even when it disclosed regions or return classes receiving far less audit attention than compliant groups.” In other words, the IRS ignored its own very expensive research.
The numbers and concepts of tax administration are complicated. But the questions they raise are simple. Does the IRS have the administrative flexibility it needs to assign the right number of properly trained people to the right districts? Does the IRS have the tools it needs to anticipate sudden demographic changes like the astonishing growth in the number of rich people between 1981 and 1987? Does the IRS, as an institution, have the political will it needs to order the shifts required to assure that taxpayers are fairly treated? Does the IRS have the sense of justice it needs to make the necessary judgments of equity that are required?
@1988 David Burnham
David Burnham, a freelance reporter, is investigating the Internal Revenue Service.

