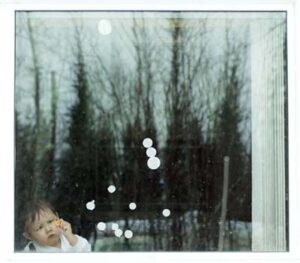
Kevin Webster couldn’t go outside to play in the snow, his favorite thing to do. A fever and lung congestion kept the active two-year old inside.
Cathy Webster, who admits she is overprotective, thought it was just a routine January cold as her eight-year old daughter Chloe was sick, too.
But when Kevin didn’t get any better after Cathy gave him children’s cold medicine and pain reliever, she took him to the health clinic.
The doctors said asthma, and while prescribed medicine eased his breathing, he still didn’t seem right.
“My sister and I were noticing his hands were really white,” she said of the little boy. “He kept running a fever.”
Cathy Webster pressed the doctors for answers and within days, Kevin, his parents, grandmother and sister were at Childrens Hospital and Regional Center in Seattle, about 1,200 miles away the family’s hometown of Fairbanks, Alaska.
Leukemia, the doctors said this time, and immediately they put the cooperative little boy on an aggressive regimen of powerful drugs and tests. He will survive, doctors predict, but must endure three and a half years of treatment.
The Websters are Athabascan Indian, and their ordeal is not new to the Athabascan community of Fairbanks. Friends and family hosted a February fundraiser to help the Webster family with expenses. In the past year fundraisers for for seven other Alaska Native cancer patients, including relatives of Kevin’s, have been held.
Cancer is now the leading cause of death for Alaska Natives, a rate that has doubled in the last 30 years, according to the latest reports from the Alaska Native Tumor Registry, a National Cancer Institute-sanctioned monitoring of cancer. Alaska Natives, of which there are just under 100,000 Eskimos, Indians and Aleuts, now face a 30 percent higher risk than U.S. whites of dying from cancer, the registry data shows.
The number of Alaska Natives with cancer is now seven percent higher than U.S. whites and past trends show that number has climbed.
The statistics have changed dramatically over the last 40 years, said Dr. Anne Lanier, a founder of the registry, and director of Alaska Native Health Research with the Alaska Native Tribal Health Consortium. The consortium operates an Indian Health Service funded hospital in Anchorage.
In 1950, cancer was rare and tuberculosis was the leading cause of death for Alaska Natives, she said.
But by the mid-1970’s, Lanier and others began studying cancer rates by reviewing Alaska Native death certificates on the advice of doctors who noticed an increase of cancer among their patients, she said.
“Experienced clinicians working in the Alaska Native health system have often reported unusual patterns of disease which were later confirmed by special studies,” Lanier said.
At first the studies showed Alaska Natives had a lower overall cancer death rate from U.S. whites, but not significantly different, she said. But what the studies did show was that rates for specifics types of cancer were higher than U.S. whites.
Now about 250 Alaska Natives are diagnosed yearly with cancer, a rate that has tripled from those early days, according to registry data.
Lanier is the principal investigator for the registry. National Cancer Institute officials, who funded the initial Alaska Native cancer studies in the 1970’s, have since sanctioned grants to further more cancer study and data collection, Lanier said.
“Early on the National Cancer Institute was also interested in what was going on in this population,” she said. The registry is now part of NCI’s Surveillance, Epidemiology and End Result program, a nationwide system that uses standard methodology for collecting and reporting cancer data.
Those subsequent NCI-funded studies have yielded alarming trends.
Lung cancer in Alaska Natives now exceeds the national average by 48 percent and according to the study Cancer Mortality Among Alaska Natives, 1994-1998, lung cancer is 30 percent of all Alaska Native cancer deaths, making it the leading cause of cancer deaths.
It’s tobacco, Lanier has said repeatedly over the years.
According to the a 1997 study by the Behavioral Risk Factor Surveillance System, a statewide telephone health survey, at least 47 percent of Alaska Native men smoked compared to 39 percent of Alaska Native women. The U.S. tobacco use average is 26 percent for males and 21 percent for females.
Smoking among Alaska Natives has shown no signs of slowing down, according to the behavior surveys, which lead Lanier and others at the tribal health consortium to believe that lung cancer rates will likely exceed U.S. whites for years to come.
Tobacco isn’t the only factor contributing to the high rates of Alaska Native cancer.
According to the Alaska Native Tumor Registry 30-year report, Alaska Native men had thirty times the death rate risk of U.S. whites from a particular type of nasopharyngeal cancer, a disease that occurs in the back of the throat and nose. This type of cancer is so rare that little is known about the disease except that is it also found among Chinese, Filipino and Vietnamese populations and may be associated with Epstein Barr Virus, the virus that can cause mononucleosis, the National Cancer Institute reports.
Alaska Natives are five times more likely to die from stomach cancer than U.S. whites; twice as likely from esophagus cancer; and one and half times from liver cancer, according to the 30-year report. The reason for the high number is also unknown, but low fruit and vegetable consumption along with alcohol and tobacco use are suspect causes for those types of cancer, according to the American Cancer Society.
A recent study by the Centers for Disease Control suggested that Helicobactor pylori, an infectious agent, may be a source in stomach cancers. Hepatitis B has been linked to liver cancer.
On the flip side, some cancers rates are still low. Data has shown that prostate cancer rates in Alaska Native men, uterine cancer in women, leukemia, and lymphoma are lower than U.S. whites. The reasons are unclear, the 30-year report said.
Both the mortality study and the 30-report suggest a plan of action.
Alaska Natives are a young population, said Gretchen Ehrsam, an epidemiologist with the Alaska Native Tribal Health Consortium and an author of the mortality study .
The median age of Alaska Natives is 23, while the U.S. median age is 36, she said. Since chances of getting cancer increase as people age and Alaska Natives are living longer, it is likely a greater number of Alaska Natives will get cancer as they get older, placing a greater burden on families, health care and society, she said.
“Cancer is an old person’s disease,” Ehrsam said. “We need to do something now.”
Finding cancer early in a treatable stage, cancer education and prevention programs are needed to help curb the climbing rates, both reports recommend.
Alaska Natives are a geographically and genetically different population from the rest of the U.S., and other American minorities including Native Americans, Ehrsam said. Understanding why rates are high may help researchers explain more about cancer in general from further study of Alaska Natives, Ehrsam said.
But many Alaska Natives wonder if something else is to blame for the cancers and other diseases they see in their communities. Leukemia, the disease that Kevin Webster has, is not high in Alaska. But that kidney, lymphoma, breast and stomach cancer has shown up in so many of Kevin’s relatives — grandparents, cousins, aunts and uncles — make some wonder if something else might be to blame for the high rates of cancer.
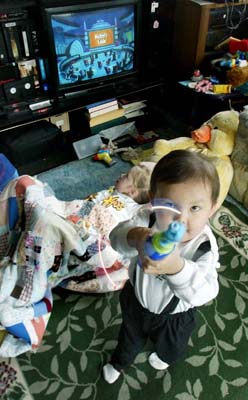
Kevin Webster, 2 1/2 years old, has been diagnosed with Leukemia and bone cancer, and is currently under chemotherapy treatment for his ailments. The ordeal, which has been going on since January, has taken a heavy toll on his mother Cathi Arnold. Kevin and Cathi have recently returned from Seattle where Kevin was being treated, and will return in May for radiation therapy. Here Kevin plays with a toy after waking up from an afternoon nap. (March 26, 2003)
Eric Engman/News-Miner
State Sen. Georgianna Lincoln is one of them. She is an Athabascan Indian from Rampart, a small community located in Interior Alaska near the Yukon River.
“At one time we counted over 60 people from Rampart with cancer,” she said. Rampart was once a military camp nearly 100 years ago and in recent times a gold mining town, a commercial salmon fishery and an agricultural station for the University of Alaska.
Lincoln remembers as a child playing with liquid mercury, rolling the silvery liquid over bare skin. Mercury was used in extracting gold from ore in Rampart and miners washed their gold in a creek, Lincoln remembers.
“We drank the water from that creek,” she said.
Mercury has not been conclusively linked to cancer, although exposure to it can cause a skin rash, and nerve and kidney damage according to the Agency for Toxic Substance and Disease Registry.
Lincoln wonders about the stories her mother told concerning buried 55-gallon drums with mysterious contents. Her mother died of kidney cancer and never smoked, Lincoln said.
Back in those days, attitudes about pollution were different, said Jerry Isaac, the president of Tanacross Village Corporation. Tanacross is an Athabascan village off the Alaska Highway in Interior Alaska.
“Antifreeze,” he said. “That makes life comfortable.” People didn’t understand the toxic properties of that product thirty years ago and in rural Alaska would dump used antifreeze and where ever was convenient, he said.

Kevin Webster, 2 1/2 years old, has been diagnosed with Leukemia and bone cancer, and is currently under chemotherapy treatment for his ailments. The ordeal, which has been going on since January, has taken a heavy toll on his mother Cathi Arnold. Kevin and Cathi have recently returned from Seattle where Kevin was being treated, and will return in May for radiation therapy. Here Kevin naps on the couch as his mother Cathi is interviewed. (March 26, 2003)
Eric Engman/News-Miner
But it wasn’t just personal mishaps that caused pollution, he said. U.S. military operations have left contaminated land in and around communities up and down the Alaska Highway, he said. His village has benefitted from cleanup jobs from some the contamination and Isaac favors an evenhanded approach to dealing with military-based pollution.
“Let’s be civil about this,” he said.
But there are more reasons to wonder illness, Isaac points out.
In 1960’s the military used Agent Orange as a defoliant on the right of way of an old 626-mile petroleum pipeline between Haines and Fairbanks, according to military documents obtained by the Champagne and Aishihik First Nations of the Yukon Territory.
The report documents testimony of Canadian Athabascans who also lived and hunted near the Alaska Highway and the pipeline route, just as Alaska tribes did.
“After the spraying, moose were found to have black stomachs when they were being gutted,” according to one of the report’s interview summary of a man from Haines Junction, YT.
“It looked like a stomach hemorrhage possibly from eating willow leaves after the spraying.”
Researchers have tied Agent Orange to Non-Hodgkin’s Lymphoma, soft tissue sarcoma, lung, larynx, bronchus and prostate cancer, birth defects and type II diabetes.
Isaac, of Tanacross, remembers warnings from his school teacher when he was a child in the 1960’s.
“The teacher instructed us to not eat the snow,” he said. Whether Isaac’s accounting had anything to do with U.S. military exercises in the area is unclear.
Late last year declassified military documents revealed that as part of a biological and chemical weapons testing program during the 1960s, called Project 112, the military tested sarin and VX, deadly nerve agents, on soldiers stationed on Fort Greely, near Delta Junction, Alaska, which is at the end of the Alaska Highway.
The documents also reveal that Bacillis globigii, a mild biological agent related to anthrax, was also sprayed on a population near Fort Greely, but just where exactly was not reported in the documents. At the time, exposure to the agent was thought to be harmless, but researchers later said that people with fragile immune systems were at risk for infections.
Lorraine Titus, the Athabascan chief of the Northway, reported that cancer appeared to have tripled in her Alaska Highway community in the early 1990’s though no official data confirms that. Contaminated soil posed a threat to the community’s water table and the U.S. Army Corps of Engineers oversaw a cleanup in the 1990’s. Titus herself discovered that her house had been built upon buried barrels of unknown chemicals.
Now the community wonders if they have been also affected by Agent Orange spraying.
“One of those places was where we picked berries,” she said.
People from other Alaska Native communities similar questions. Aleuts that live around Amchitka Island, the Alaskan site of three underground atomic explosions in 1965, 1969 and 1971, demand to know, despite government assurances, if the food they harvest from the sea is safe. New government studies are reexamining the issue now 30 years since the last radiation tests were conducted on and around the island. The findings are due shortly.
On the North Slope, Inupiat Eskimos wonder how pollution from the U.S. and other countries and carried by ocean and wind currents to their communities affect their wild foods from land and sea.
Annie Alowa, an Yupik Eskimo elder and activist from St. Lawrence Island attributed her cancer from contamination caused by military dumps on the Bering Sea Island she lived. She died in 1999 from the disease.
Alaska Native Cancer Registry data has not yielded cancer clusters, an official grouping of people with cancer caused by contamination, registry officials have said. Accorind to their figures, only about 11 percent of cancer could be attributed to toxic exposure or some other unknown cause.
For Cathy Webster, much of the debate over what causes cancer in Alaska holds little meaning for her. At first she wondered if she had done something to cause her son’s illness. Doctors reassured her she did not.
In two short months, She has become a reluctant medical expert. Kevin, his face puffy from the powerful steroid he took to kill cancer cells, now eyes strangers with more wariness than he used to before his diagnosis, his mother said.
“This has all changed him so much,” his mother said. The cancer treatment so far has made him weak and he can’t run and jump like he did before he was sick, she said.
Kevin will survive, Cathy explains back at home in Fairbanks. But it will be a rough course. He’ll have to go back to Seattle in May for a more aggressive course of chemotherapy.
He will endure another three and half years of needle sticks, spinal taps, fevers, trips back to Seattle and frustration. Kevin’s parents worry about money and bills.
Her days are spent finding normalcy in the family’s routine.
“I cannot be concerned about the world right now,” she said. “All I have is for my kids.”
Figures and Tables
| Table 1. Average Annual Age-Adjusted† Cancer Mortality Rates per 100,000 for Alaska Natives and U.S. Whites, Males and Females combined,1994-1998. | |||||||
# of Cases | AK Rate | US Rate | Odds Ratio | Lower C.I. | Upper C.I. | ||
| All Sites | 597 | 224.5 | 166.7 | 1.3 | * | 1.2 | 1.4 |
| Oral Cavity and Pharynx | 20 | 7.8 | 2.4 | 2.9 | * | 1.9 | 4.6 |
| Salivary Gland | 0 | – | 0.2 | – | – | – | |
| Gum and Other Mouth | 2 | – | 0.4 | – | – | – | |
| Nasopharynx | 12 | 4.8 | 0.2 | 20.4 | * | 11.5 | 36.2 |
| Digestive System | 209 | 77.6 | 37.5 | 2.2 | * | 1.7 | 2.3 |
| Esophagus | 18 | 7.2 | 3.4 | 1.9 | * | 1.2 | 3.1 |
| Stomach | 51 | 17.1 | 3.6 | 4.9 | * | 3.7 | 6.4 |
| Colon and Rectum | 84 | 31.9 | 17 | 1.7 | * | 1.4 | 2.2 |
| Colon | 66 | 25.5 | 14.5 | 1.6 | * | 1.3 | 2.1 |
| Rectum & Rectosigmoid Jxn. | 18 | 6.4 | 2.5 | 2.5 | * | 1.6 | 4 |
| Liver | 17 | 6.4 | 3.4 | 1.8 | * | 1.1 | 2.9 |
| Gallbladder | 4 | – | 0.6 | – | – | – | |
| Other Biliary | 1 | – | 0.5 | – | – | – | |
| Pancreas | 34 | 12.7 | 8.2 | 1.5 | * | 1.1 | 2.1 |
| Respiratory System | 184 | 73.9 | 50.2 | 1.4 | * | 1.2 | 1.6 |
| Larynx | 5 | 1.9 | 1.2 | 1.6 | 0.7 | 3.8 | |
| Lung and Bronchus | 179 | 72 | 48.6 | 1.4 | * | 1.2 | 1.6 |
| Bones and Joints | 1 | – | 0.4 | – | – | – | |
| Soft Tissue | 0 | – | 1.3 | – | – | – | |
| Skin | 3 | – | 3.3 | – | – | – | |
| Melanomas of the Skin | 3 | – | 2.6 | – | – | – | |
| Other Non-Epithelial Skin | 0 | – | 0.7 | – | – | – | |
| Breast | 35 | 11.2 | 13.6 | 0.9 | 0.6 | 1.2 | |
| Female Genital System | 17 | 11.1 | 14 | 0.8 | 0.5 | 1.2 | |
| Cervix | 3 | 1.8 | 2.4 | – | – | – | |
| Corpus and Uterus, NOS | 0 | – | 3.2 | – | – | – | |
| Ovary | 14 | 9.2 | 7.7 | 1.2 | 0.7 | 2 | |
| Male Genital System | 13 | 12 | 22.5 | 0.5 | * | 0.3 | 0.8 |
| Prostate | 13 | 12 | 22.1 | 0.5 | 0.3 | 0.8 | |
| Testis | 0 | – | 0.3 | – | – | – | |
| Urinary System | 25 | 10.2 | 7.2 | 1.2 | 0.8 | 1.8 | |
| Urinary Bladder | 4 | – | 3.5 | – | – | – | |
| Kidney and Renal Pelvis | 21 | 8.4 | 3.6 | 2 | * | 1.3 | 3.1 |
| Eye and Orbit | 0 | – | 0.1 | – | – | – | |
| Brain and Other Nervous System | 5 | 1.4 | 4.5 | 0.3 | * | 0.1 | 0.8 |
| Brain | 4 | – | 4.4 | – | – | – | |
| Endocrine System | 0 | – | 0.7 | – | – | – | |
| Thyroid | 0 | – | 0.4 | – | – | – | |
| Lymphoma | 11 | 4 | 7.8 | 0.5 | * | 0.3 | 0.8 |
| Hodgkin’s Disease | 0 | – | 0.5 | – | – | – | |
| Non-Hodgkin’s | 11 | 4 | 7.4 | 0.5 | 0.1 | 1.9 | |
| Multiple Myeloma | 6 | 2.2 | 2.9 | 0.7 | 0.3 | 1.7 | |
| Leukemia | 13 | 3.7 | 6.5 | 0.6 | 0.4 | 1.1 | |
| Ill Defined | 53 | 19.2 | 11.5 | 1.6 | * | 1.2 | 2.1 |
†All rates age-adjusted 1970 U.S. population; * 95% confidence intervals for odds ratios do not include 1. | |||||||
| Table 2. Average Annual Age-Adjusted† Cancer Mortality Rates per 100,000 for Alaska Natives and U.S. White Males 1994-1998. | |||||||
# of Cases | AK Rate | US Rate | Odds Ratio | Lower C.I. | Upper C.I. | ||
| All Sites | 323 | 261.8 | 201.8 | 1.3 | * | 1.1 | 1.4 |
| Oral Cavity and Pharynx | 16 | 12.7 | 3.5 | 3.4 | * | 2.1 | 5.5 |
| Salivary Gland | 0 | – | 0.3 | – | – | – | |
| Gum and Other Mouth | 1 | – | 0.6 | – | – | – | |
| Nasopharynx | 11 | 9 | 0.3 | 27.1 | * | 14.8 | 49.4 |
| Digestive System | 108 | 85.2 | 47 | 1.8 | * | 1.5 | 2.2 |
| Esophagus | 11 | 9.2 | 5.9 | 1.4 | 0.8 | 2.6 | |
| Stomach | 35 | 25.3 | 5.1 | 5.2 | * | 3.8 | 7.3 |
| Colon and Rectum | 34 | 27.7 | 20.1 | 1.4 | * | 1 | 2 |
| Colon | 26 | 22 | 16.9 | 1.2 | 0.8 | 1.8 | |
| Rectum & Rectosigmoid Jxn. | 8 | 5.7 | 3.2 | 3.3 | * | 2 | 5.6 |
| Liver | 10 | 8.1 | 4.8 | 1.6 | 0.9 | 3 | |
| Gallbladder | 3 | – | 0.4 | – | – | – | |
| Other Biliary | 1 | – | 0.6 | – | – | – | |
| Pancreas | 14 | 11.1 | 9.4 | 1.4 | 0.9 | 2.3 | |
| Respiratory System | 124 | 104.4 | 69.6 | 1.4 | * | 1.2 | 1.7 |
| Larynx | 5 | 3.8 | 2.1 | 1.9 | 0.8 | 4.5 | |
| Lung and Bronchus | 119 | 100.6 | 66.9 | 1.4 | * | 1.2 | 1.7 |
| Bones and Joints | 0 | – | 0.5 | – | – | – | |
| Soft Tissue | 0 | – | 1.4 | – | – | – | |
| Skin | 1 | – | 4.7 | – | – | – | |
| Melanomas of the Skin | 1 | – | 3.6 | – | – | – | |
| Other Non-Epithelial Skin | 0 | – | 1 | – | – | – | |
| Breast | 0 |
| 0.2 | – | – | – | |
| Male Genital System | 13 | 12 | 22.5 | 0.5 | * | 0.3 | 0.8 |
| Prostate | 13 | 12 | 22.1 | 0.5 | * | 0.3 | 0.8 |
| Testis | 0 | – | 0.3 | – | – | – | |
| Urinary System | 11 | 10.2 | 11.1 | 0.8 | 0.4 | 1.4 | |
| Urinary Bladder | 2 | – | 5.7 | – | – | – | |
| Kidney and Renal Pelvis | 9 | 8.1 | 5.1 | 1.3 | 0.7 | 2.5 | |
| Eye and Orbit | 0 | – | 0.1 | – | – | – | |
| Brain and Other Nervous System | 3 | – | 5.4 | – | – | – | |
| Brain | 3 | – | 5.3 | – | – | – | |
| Endocrine System | 0 | – | 0.7 | – | – | – | |
| Thyroid | 0 | – | 0.3 | – | – | – | |
| Lymphoma | 7 | 5.2 | 9.5 | 0.5 | 0.1 | 2.7 | |
| Hodgkin’s Disease | 0 | – | 0.5 | – | – | – | |
| Non-Hodgkin’s | 7 | 5.2 | 8.9 | 0.6 | 0.3 | 1.2 | |
| Multiple Myeloma | 2 | – | 3.5 | – | – | – | |
| Leukemia | 7 | 4.8 | 8.4 | 0.6 | 0.3 | 1.2 | |
| Ill Defined | 31 | 23.8 | 13.8 | 1.7 | * | 1.2 | 2.4 |
†All rates age-adjusted 1970 U.S. population; * 95% confidence intervals for odds ratios do not include 1. | |||||||
| Table 3. Average Annual Age-Adjusted† Cancer Mortality Rates per 100,000 for Alaska Natives and U.S. White Females 1994-1998. | |||||||
| # of Cases | AK Rate | US Rate | Odds Ratio | Lower C.I. | Upper C.I. | |
| All Sites | 274 | 187.2 | 141.6 | 1.3 | * | 1.1 | 1.4 |
| Oral Cavity and Pharynx | 4 | – | 1.4 | – | – | – | |
| Salivary Gland | 0 | – | 0.1 | – | – | – | |
| Gum and Other Mouth | 1 | – | 0.3 | – | – | – | |
| Nasopharynx | 1 | – | 1.4 | – | – | – | |
| Digestive System | 101 | 70 | 29.9 | 2.2 | * | 1.8 | 2.7 |
| Esophagus | 7 | 5.3 | 1.4 | 3.4 | * | 1.6 | 7.2 |
| Stomach | 16 | 8.8 | 2.5 | 4 | * | 2.5 | 6.6 |
| Colon and Rectum | 50 | 36.2 | 13.6 | 2.2 | * | 1.7 | 2.9 |
| Colon | 40 | 29.1 | 14.6 | 2.1 | * | 1.5 | 2.8 |
| Rectum and Rectosigmoid Jxn. | 10 | 7.1 | 2 | 3.2 | * | 1.7 | 6 |
| Liver | 7 | 4.7 | 2.3 | 2 | * | 1 | 4.2 |
| Gallbladder | 1 | – | 0.8 | – | – | – | |
| Other Biliary | 0 | – | 0.4 | – | – | – | |
| Pancreas | 20 | 14.2 | 7.2 | 1.8 | * | 1.2 | 2.8 |
| Respiratory System | 60 | 43.3 | 35.6 | 1.2 | 0.9 | 1.5 | |
| Larynx | 0 | – | 0.5 | – | – | – | |
| Lung and Bronchus | 60 | 43.3 | 34.9 | 1.2 | 0.9 | 1.5 | |
| Bones and Joints | 1 | – | 0.3 | – | – | – | |
| Soft Tissue | 0 |
| 1.2 | – | – | – | |
| Skin | 2 | – | 2.2 | – | – | – | |
| Melanomas of the Skin | 2 | – | 1.8 | – | – | – | |
| Other Non-Epithelial Skin | 0 | – | 0.4 | – | – | – | |
| Breast | 35 | 22.4 | 24.4 | 0.9 | 0.7 | 1.3 | |
| Female Genital System | 17 | 11.1 | 14 | 0.8 | 0.5 | 1.2 | |
| Cervix | 3 | 1.8 | 2.4 | – | – | – | |
| Corpus and Uterus, NOS | 0 | – | 3.2 | – | – | – | |
| Ovary | 14 | 9.2 | 7.7 | 1.2 | 0.7 | 2 | |
| Urinary System | 14 | 10.2 | 4.4 | 2.1 | * | 1.2 | 3.5 |
| Urinary Bladder | 2 | – | 1.8 | – | – | – | |
| Kidney and Renal Pelvis | 12 | 8.6 | 2.4 | 3.3 | * | 1.9 | 5.8 |
| Eye and Orbit | 0 | – | 0.1 | – | – | – | |
| Brain and Other Nervous System | 2 | – | 3.7 | – | – | – | |
| Brain | 1 | – | 3.6 | – | – | – | |
| Endocrine System | 0 | – | 0.7 | – | – | – | |
| Thyroid | 0 | – | 0.4 | – | – | – | |
| Lymphoma | 4 | – | 6.5 | – | – | – | |
| Hodgkin’s Disease | 0 | – | 0.4 | – | – | – | |
| Non-Hodgkin’s | 4 | – | 6.1 | – | – | – | |
| Multiple Myeloma | 4 | – | 2.4 | – | – | – | |
| Leukemia | 6 | 2.6 | 5.1 | 0.7 | 0.3 | 1.5 | |
| Ill Defined | 22 | 14.6 | 9.7 | 1.6 | * | 1.1 | 2.5 |
†All rates age-adjusted 1970 U.S. population; * 95% confidence intervals for odds ratios do not include 1. | |||||||
Web Resources include:
Military biological and chemical weapons testing:
www.deploymentlink.osd.mil/current_issues/shad/shad_intro.shtml
Alaska Native Tribal Health Consortium
www.anthc.org
Native Village of Tanacross
www.nativevillageoftanacross.com/
St. Lawrence Island
www.akaction.net
©2003Diana Campbell. A business reporter for the Fairbanks Daily News-Miner, Diana Campbell is looking at the incidence of cancer among Alaska natives.